
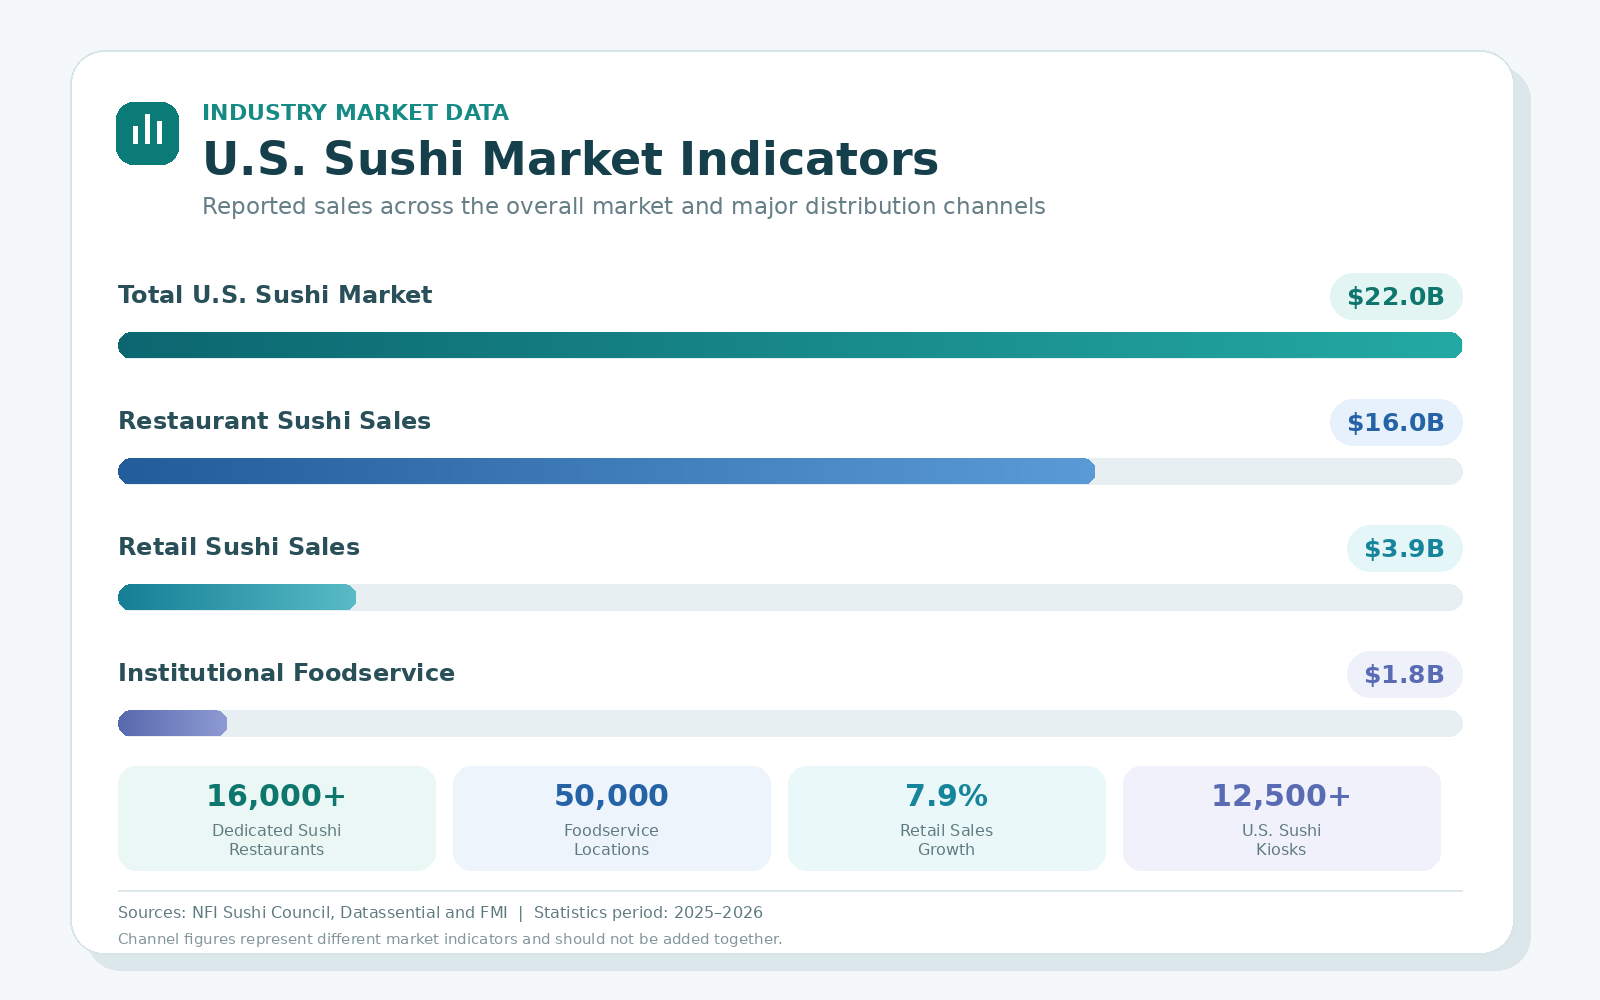
The U.S. sushi industry has entered a new stage of growth. According to industry research released in 2026, sushi sales in the United States have reached approximately $22 billion, making the American market significantly larger and more diverse than many operators may realize.
Restaurants remain the largest part of the industry, generating approximately $16 billion in annual sushi sales. The United States now has more than 16,000 dedicated sushi restaurants, while sushi also appears on the menus of many Japanese, Asian-fusion and general foodservice establishments.
In 2025, sushi appeared on approximately 7.1% of U.S. restaurant menus, representing close to 50,000 foodservice locations. These figures demonstrate that sushi is no longer limited to specialized Japanese restaurants. It is increasingly available through supermarkets, corporate dining programs, hospitals, universities and other nontraditional locations.
Retail Sushi Continues to Expand
Retail has become another important growth channel. U.S. grocery-store sushi sales reached approximately $3.9 billion in 2025, an increase of 7.9% in dollar sales and 7.4% in volume compared with the previous year.
More than 12,500 sushi kiosks are currently operating across the United States, primarily in supermarkets. However, industry research indicates that many major retail, corporate and institutional locations still do not offer dedicated sushi programs, leaving significant room for future expansion.
Consumer interest is particularly strong among Millennials and Generation Z. Sushi meets several of their purchasing priorities:
- Convenient grab-and-go formats
- Seafood-based meal options
- Global and Japanese flavors
- Visually appealing presentation
- Flexible choices for dine-in, delivery and retail sales
What This Means for Foodservice Buyers
As the market expands, restaurants and retailers need more than individual ingredients. They require a dependable supply system capable of providing consistent specifications, food-safety documentation and appropriate temperature control.
Products positioned to benefit from continued sushi growth include:
- Sashimi-grade tuna and salmon
- Sushi ebi and tempura shrimp
- Unagi and other prepared seafood
- Sushi nori
- Sushi rice and seasonings
- Soy sauce, wasabi and pickled ginger
- Frozen appetizers and ready-to-serve products
- Trays, containers and other takeout supplies
Consistent portion sizing is becoming especially important. Standardized seafood cuts and ready-to-use ingredients can help operators control food costs, reduce preparation time and maintain product consistency across locations.
Import Supply Remains Essential
The growth of sushi is closely connected with the international seafood supply chain. NOAA estimates that the United States imported 6.3 billion pounds of edible seafood products in 2023 and that approximately 80% of the seafood consumed by Americans came from foreign imports.
This import dependence makes supplier reliability, product traceability and cold-chain management essential considerations for restaurant and retail buyers.
Preparing for the Next Stage of Growth
Sushi’s continued expansion beyond traditional restaurants is creating opportunities throughout the Japanese food industry. Grocery stores, universities, hospitals, corporate dining programs and regional retailers all represent potential growth channels.
Foodservice businesses preparing for this demand should review their core ingredients, portion specifications, packaging formats and inventory plans before adding new menu items or expanding into grab-and-go sushi.
SHO ICHI INC. supports wholesale buyers with authentic Japanese food products, frozen and refrigerated distribution, product sourcing and regional delivery throughout the Eastern United States.
Industry Market Data
U.S. Sushi Market Indicators
Reported sales across the overall U.S. sushi market and major distribution channels.
Total U.S. Sushi Market $22.0B Restaurant Sushi Sales $16.0B Retail Sushi Sales $3.9B Institutional Foodservice $1.8B 16,000+ Dedicated Sushi Restaurants 50,000 Foodservice Locations 7.9% Retail Sales Growth 12,500+ U.S. Sushi Kiosks
Sources: NFI Sushi Council, Datassential and FMI — The Food Industry Association.
Statistics period: 2025–2026. Channel figures represent different market indicators and should not be added together.
Industry Market Data
U.S. Sushi Market Indicators
Reported sales across the overall U.S. sushi market and major distribution channels.
Total U.S. Sushi Market $22.0B Restaurant Sushi Sales $16.0B Retail Sushi Sales $3.9B Institutional Foodservice $1.8B 16,000+ Dedicated Sushi Restaurants 50,000 Foodservice Locations 7.9% Retail Sales Growth 12,500+ U.S. Sushi Kiosks
Sources: NFI Sushi Council, Datassential and FMI — The Food Industry Association.
Statistics period: 2025–2026. Channel figures represent different market indicators and should not be added together.